2026 Bitcoin Cash-Out Index: All 50 States Ranked

Head of Marketing, Arch Lending
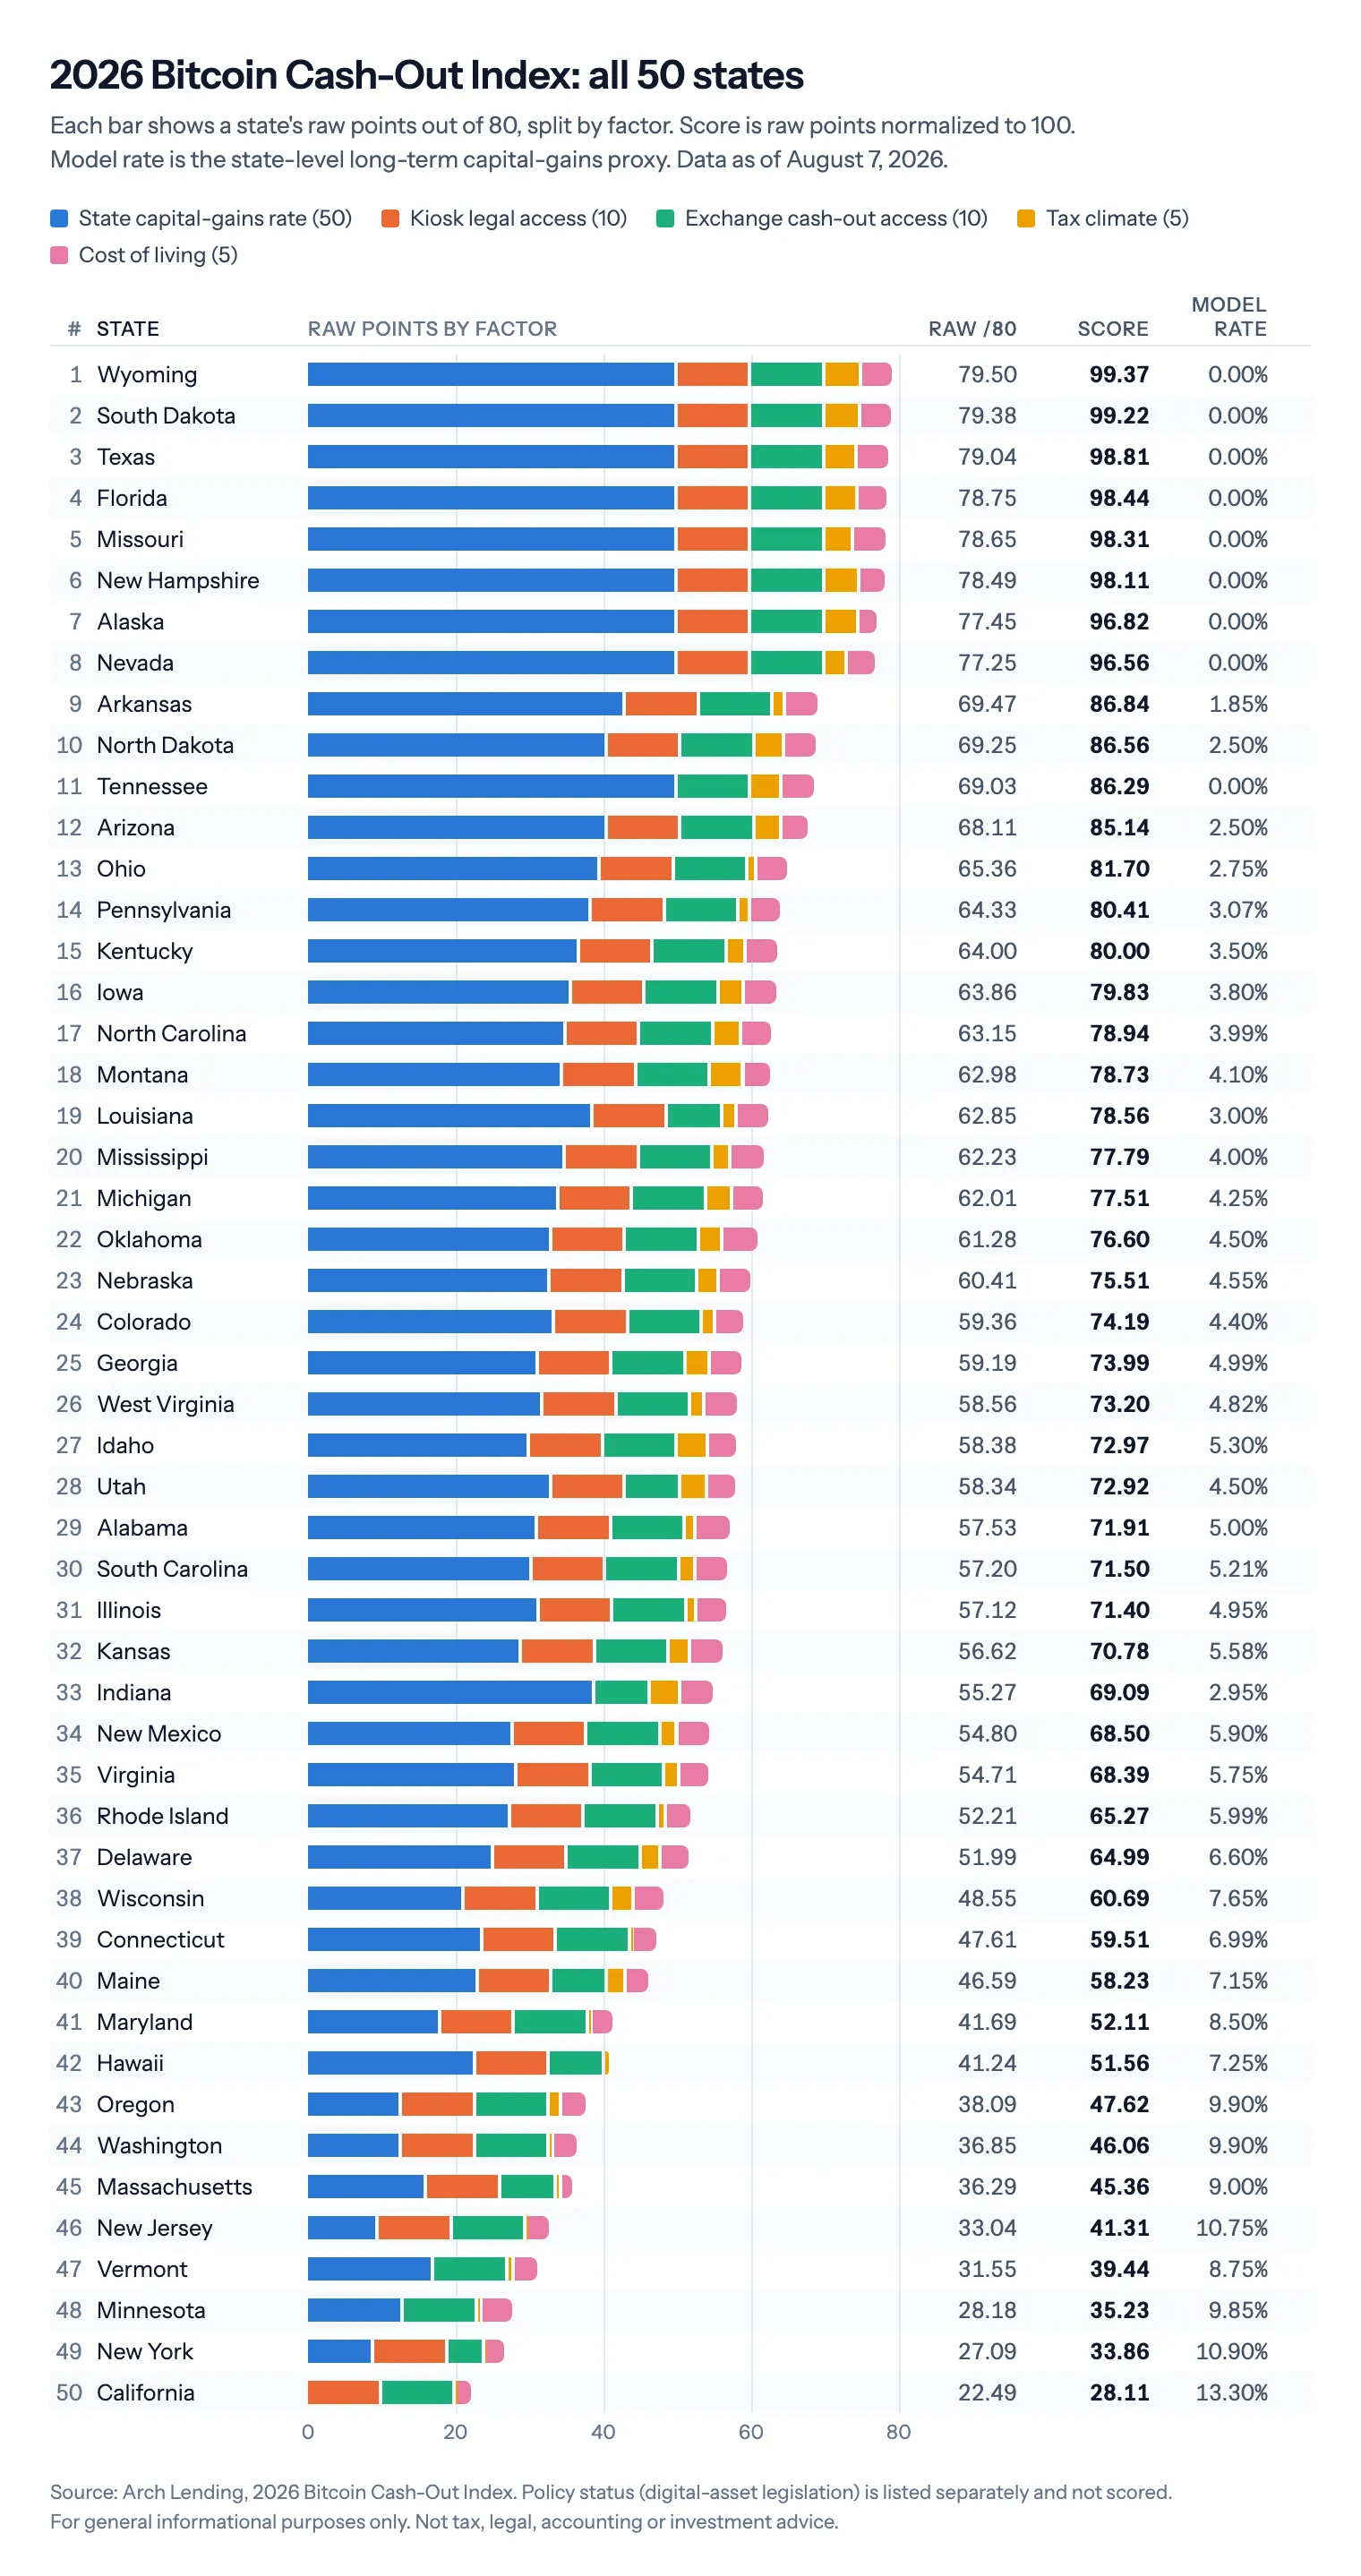
Arch Lending’s 2026 Bitcoin Cash-Out Index compares the tax and access conditions Bitcoin holders face when selling across all 50 states.
Wyoming ranks first and California last. The top eight states all carry a 0% model capital-gains rate, and four states ban crypto kiosks statewide.
Wyoming scores 99.37 out of 100, reflecting the most favorable combination of factors under the index. South Dakota follows at 99.22 and Texas at 98.81. California ranks 50th at 28.11 and has the highest model capital-gains rate in the index at 13.30%, the factor that carries the most weight in the scoring.
How the index scores each state
The index scores each state on five factors:
- State capital-gains rate (50 points)
- Kiosk legal access (10 points)
- Exchange cash-out access (10 points)
- Overall tax competitiveness (5 points)
- Cost of living (5 points)
The state capital-gains rate accounts for 50 of the 80 available raw points. Raw scores are then normalized to a score out of 100.
Taxes drive the top of the rankings
The eight top-ranked states, Wyoming, South Dakota, Texas, Florida, Missouri, New Hampshire, Alaska and Nevada, all have a 0% model capital-gains rate. After California, the highest rates are in New York at 10.90% and New Jersey at 10.75%.
The index compares conditions at the state level, giving holders a clearer view of what can shape a sale depending on where they live. An individual’s tax bill and proceeds will still depend on their own circumstances.
Access also moves the rankings
Four states have statewide crypto kiosk bans reflected in the index: Indiana, Minnesota, Tennessee and Vermont.
Tennessee has a 0% model capital-gains rate but ranks 11th after its kiosk ban took effect on July 1, 2026. Minnesota’s ban took effect on August 1, 2026. In New York, two of the four platforms tracked by the index offer cash-out access to residents.
Top-ranked states
| Rank | State | Score |
|---|---|---|
| 1 | Wyoming | 99.37 |
| 2 | South Dakota | 99.22 |
| 3 | Texas | 98.81 |
| 4 | Florida | 98.44 |
| 5 | Missouri | 98.31 |
| 6 | New Hampshire | 98.11 |
| 7 | Alaska | 96.82 |
| 8 | Nevada | 96.56 |
| 9 | Arkansas | 86.84 |
| 10 | North Dakota | 86.56 |
Lowest-ranked states
| Rank | State | Score |
|---|---|---|
| 46 | New Jersey | 41.31 |
| 47 | Vermont | 39.44 |
| 48 | Minnesota | 35.23 |
| 49 | New York | 33.86 |
| 50 | California | 28.11 |
Full 50-state rankings
The chart below shows every state’s score, its raw points by factor and its model capital-gains rate.
| Rank | State | Score | Model rate |
|---|---|---|---|
| 1 | Wyoming | 99.37 | 0.00% |
| 2 | South Dakota | 99.22 | 0.00% |
| 3 | Texas | 98.81 | 0.00% |
| 4 | Florida | 98.44 | 0.00% |
| 5 | Missouri | 98.31 | 0.00% |
| 6 | New Hampshire | 98.11 | 0.00% |
| 7 | Alaska | 96.82 | 0.00% |
| 8 | Nevada | 96.56 | 0.00% |
| 9 | Arkansas | 86.84 | 1.85% |
| 10 | North Dakota | 86.56 | 2.50% |
| 11 | Tennessee | 86.29 | 0.00% |
| 12 | Arizona | 85.14 | 2.50% |
| 13 | Ohio | 81.70 | 2.75% |
| 14 | Pennsylvania | 80.41 | 3.07% |
| 15 | Kentucky | 80.00 | 3.50% |
| 16 | Iowa | 79.83 | 3.80% |
| 17 | North Carolina | 78.94 | 3.99% |
| 18 | Montana | 78.73 | 4.10% |
| 19 | Louisiana | 78.56 | 3.00% |
| 20 | Mississippi | 77.79 | 4.00% |
| 21 | Michigan | 77.51 | 4.25% |
| 22 | Oklahoma | 76.60 | 4.50% |
| 23 | Nebraska | 75.51 | 4.55% |
| 24 | Colorado | 74.19 | 4.40% |
| 25 | Georgia | 73.99 | 4.99% |
| 26 | West Virginia | 73.20 | 4.82% |
| 27 | Idaho | 72.97 | 5.30% |
| 28 | Utah | 72.92 | 4.50% |
| 29 | Alabama | 71.91 | 5.00% |
| 30 | South Carolina | 71.50 | 5.21% |
| 31 | Illinois | 71.40 | 4.95% |
| 32 | Kansas | 70.78 | 5.58% |
| 33 | Indiana | 69.09 | 2.95% |
| 34 | New Mexico | 68.50 | 5.90% |
| 35 | Virginia | 68.39 | 5.75% |
| 36 | Rhode Island | 65.27 | 5.99% |
| 37 | Delaware | 64.99 | 6.60% |
| 38 | Wisconsin | 60.69 | 7.65% |
| 39 | Connecticut | 59.51 | 6.99% |
| 40 | Maine | 58.23 | 7.15% |
| 41 | Maryland | 52.11 | 8.50% |
| 42 | Hawaii | 51.56 | 7.25% |
| 43 | Oregon | 47.62 | 9.90% |
| 44 | Washington | 46.06 | 9.90% |
| 45 | Massachusetts | 45.36 | 9.00% |
| 46 | New Jersey | 41.31 | 10.75% |
| 47 | Vermont | 39.44 | 8.75% |
| 48 | Minnesota | 35.23 | 9.85% |
| 49 | New York | 33.86 | 10.90% |
| 50 | California | 28.11 | 13.30% |
Selling is one option
“Most long-term Bitcoin holders will need liquidity at some point, and the conditions around selling look very different depending on the state they live in,” said Himanshu Sahay, Co-Founder of Arch Lending. “We built the index to make those differences easier to see. Selling is one option, and taking out a Bitcoin-backed loan is another. Understanding how each one works and what it costs matters before deciding which route to take.”
To learn how borrowing against Bitcoin works, see Arch’s guide to Bitcoin-backed loans.
Methodology
The 2026 Bitcoin Cash-Out Index uses data available as of August 7, 2026. Raw scores are calculated out of 80 points and normalized to 100.
The state capital-gains factor is a state-level proxy for long-term capital gains. Federal and local taxes, cost basis, holding period, deductions, exemptions and residency rules sit outside its scope.
Kiosk legal access looks at whether an effective statewide ban is in place. Exchange cash-out access reflects official state availability guidance for Coinbase, Kraken, Gemini and Crypto.com.
Overall tax competitiveness uses the Tax Foundation’s 2026 State Tax Competitiveness Index, and cost of living uses MERIC’s Q1 2026 index. State digital-asset legislation, including Bitcoin reserve laws in Arizona, New Hampshire and Texas, is listed separately and is not scored.
Additional detail on the methodology and the raw inputs behind each score is available on request.
About Arch Lending
Arch Lending is a U.S.-based lending platform that lets holders of Bitcoin, Ethereum, Solana, XRP, PAX Gold and Tether Gold borrow against their holdings without selling. Eligible client assets are held 1:1 in segregated custody with Anchorage Digital, a federally chartered bank and qualified custodian, and are not rehypothecated. Arch Lending is operated by ChainFi, Inc. Learn more at archlending.com.
Disclaimer: The 2026 Bitcoin Cash-Out Index is for general informational purposes only. It is not tax, legal, accounting or investment advice and does not estimate any person’s total tax liability or transaction outcome. Laws, platform availability and market conditions can change. Consult qualified professional advisers regarding individual circumstances.